This screenshot shows the strategy description and performance along with messages warning if something looks odd about the data. The data was checked and all the price jumps turn out to be real with the prices agreeing with prices from other sources.
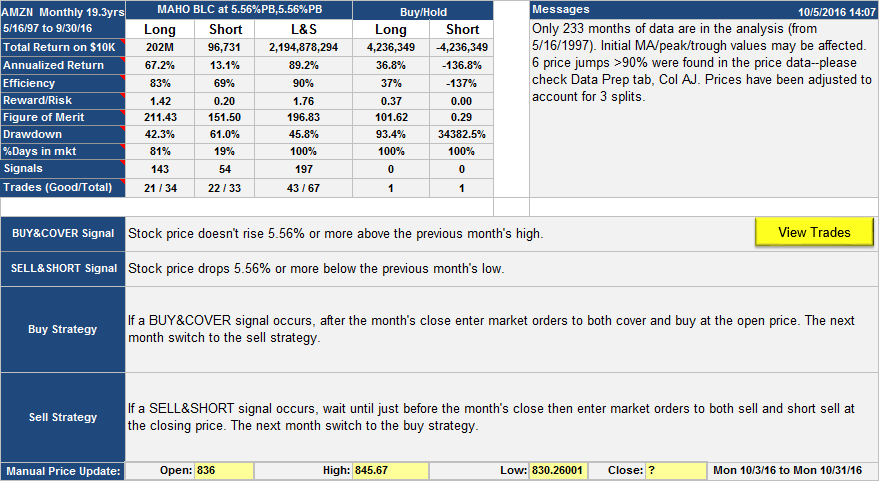
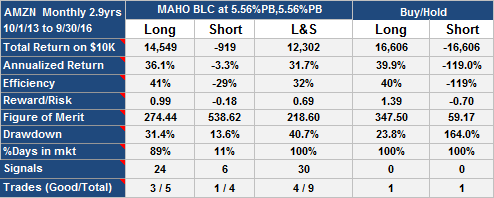
The strategy used Long and Short investment style, so was always in the market long or short. The short side trades didn't do nearly as well as the long side trades, but well enough to boost the overall performance by a factor of almost 10. Also, the short trades had an efficiency of 69%, so for the short time that the strategy was short it did quite well.
Trading was at most once per month, trading a total of 67 round trips over the lifetime. 43 of these trades were good
This is a straightforward type of Percentage Band algorithm. Buy signals occurred in months when the stock price failed to rise, at any time, 5.6% above the high of the previous month. This happened 143 times out of the 243 months of data. The buy was at the following month's open, but it only happened 34 times because the position was already long in most cases.
Sell signals occurred whenever the stock price fell 5.56% below the previous month's low at any time in the month. Usually, there was a buy signal the same month as a sell signal; there were 92 buy signal only months, 3 sell signal only months and 53 dual signal months. For this type of algorithm, if you are long you have to sell if a sell signal occurs, and you have to buy if a buy signal occurs when you are short. This is all explained in this video.
Here is the equity curve for the strategy, along with the signals and positions mapped out.
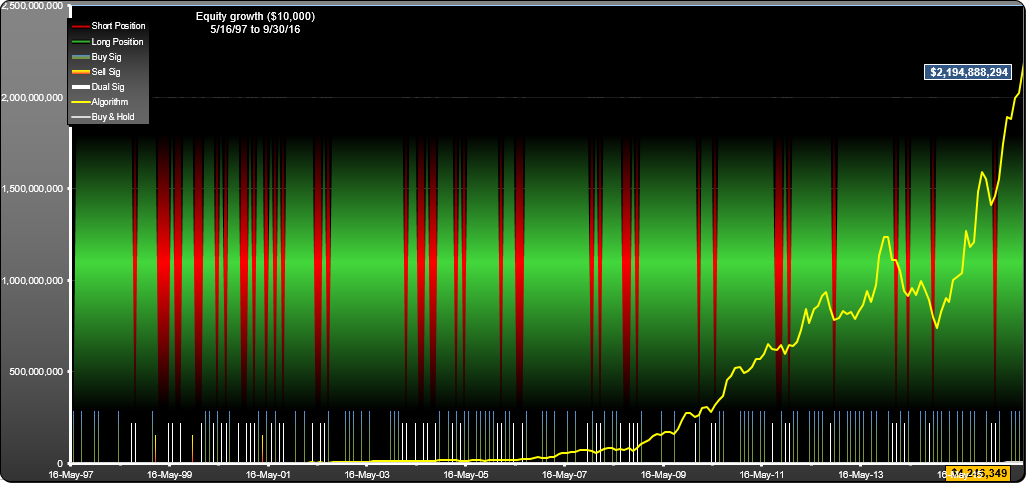
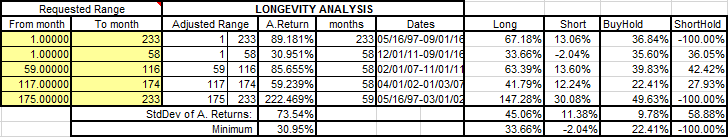
It looks as though the equity curve is still rising rapidly, however a closer look at the returns over different time periods (below) shows that most of the strategy gains occurred in the 1997 to 2002 time period. In fact, in the most recent quartus (one fourth of the data, 2011 -16) the strategy did not quite keep up with buy/hold (31% vs 35.6% annualized).
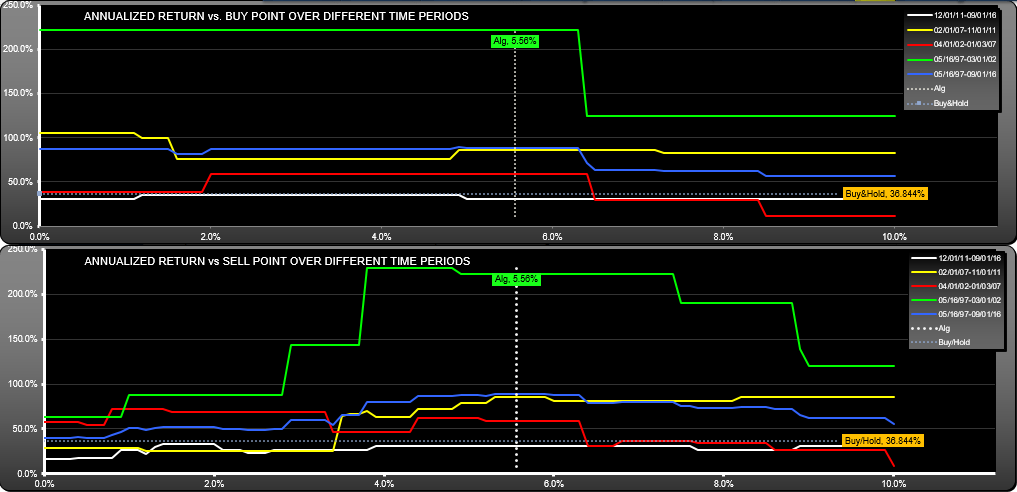
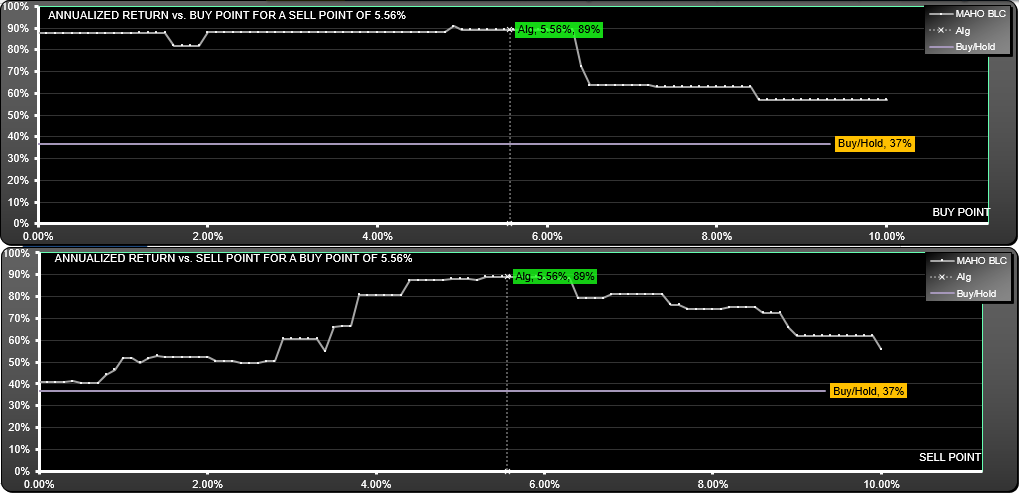
Looking at how changes in the parameters affect return, we see a broad area over which the buy parameters worked with a slightly narrower range for the sell parameter.
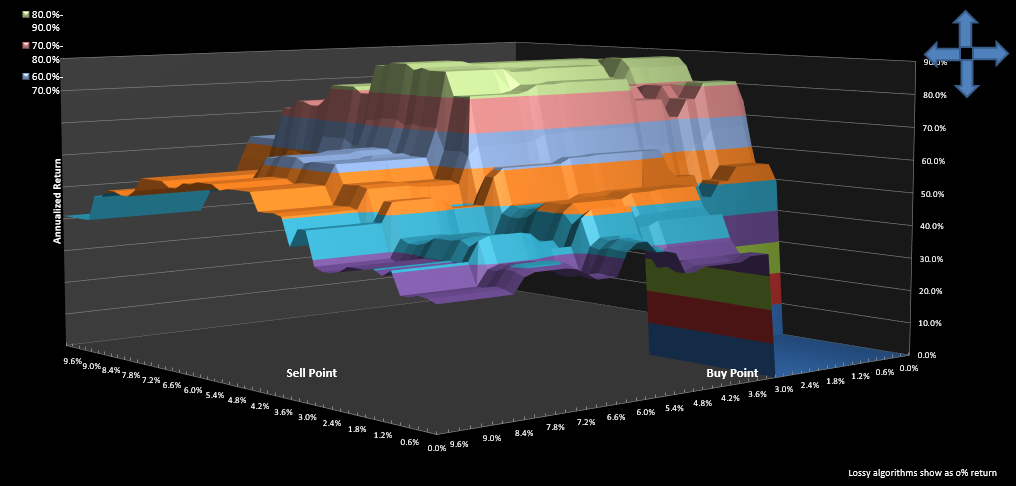
The parameter surface shows a nice large structure, showing that sensitivity to parameter changes was fairly low, but remember most of the gains were focused in the 97-02 timeframe.
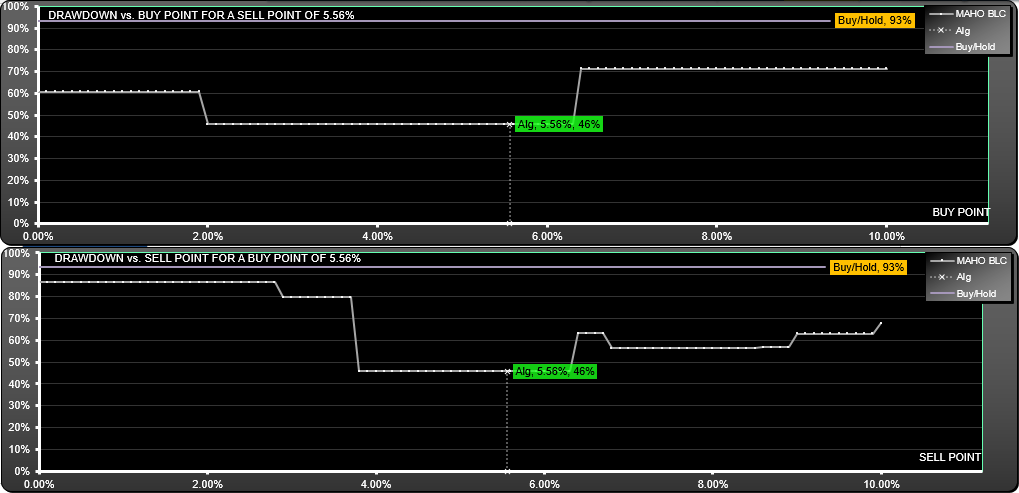
Drawdown for the strategy was much better than for buy-hold (46% vs 93%) and not overly sensitive to parameter change:
You can take a look at the buy-sell points on the trades list. As always, please be aware that there is no guarantee that this strategy will work in the future.
Recent performance
For the most recent 2.9 years, here is the performance table.
There are not enough trades to make any firm conclusions about where the optimum parameters are now, but there is evidence to suggest that the buy point has pulled in somewhat. I suggest you download SignalSolver and optimize for different timeframes to get a feel for where the parameters might have moved to.