AMZN top 4 algorithms day by day

The out of sample multi-algorithm approach was quite successful for AMZN (see results) so lets do it live and see how it ends up. On Dec 21st, I did the optimization using the EMA band and Figure of merit optimization I have been talking about in the last few posts. For the next 25 trading days and maybe beyond, I will update the following trading guidelines for the top 4 algorithms. All these strategies were found using SignalSolver.

Update Feb 23rd 2017: Summary and Wrap Up: 10, 25 and 42 day

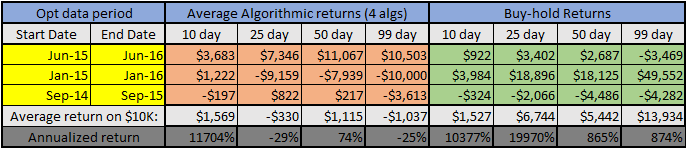
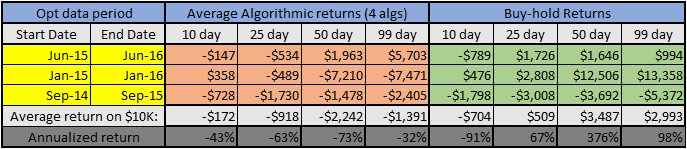
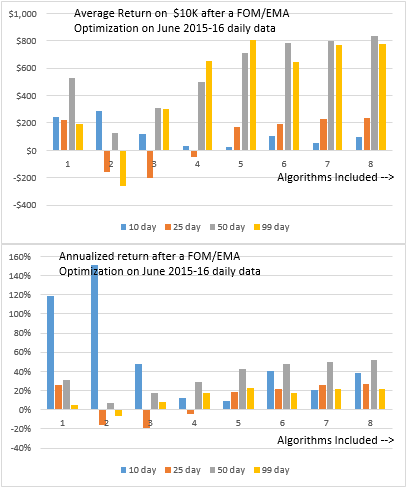
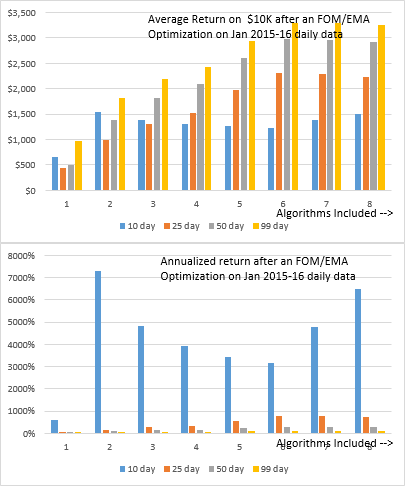
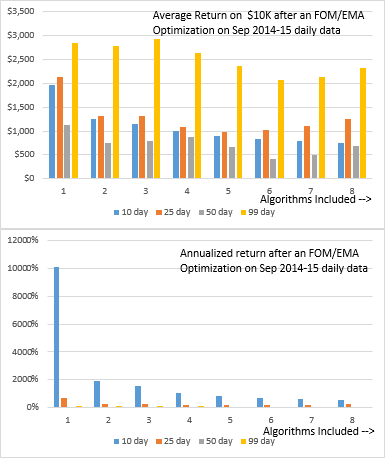
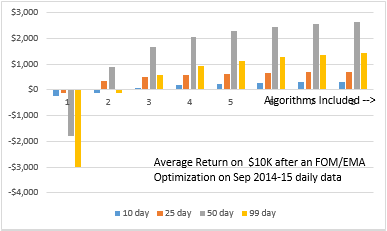
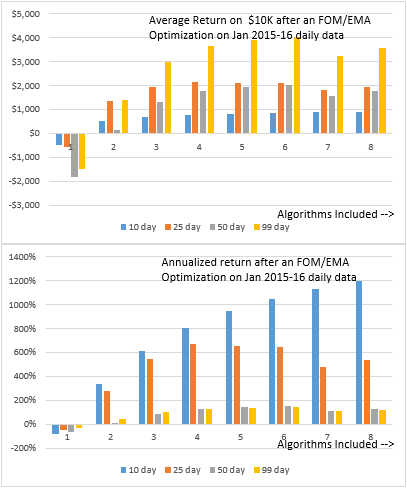
I'd like to wrap up this study by publishing the 25 day results as promised. Since yesterday was day 42, I've also added in the 42 day results although the algorithms were never expected to have a 42 day lifetime.  I'm happy to report that the algorithms were profitable. As predicted, the 10 day results gave the best average annualized return (121%) for the algorithms, with a noticeable fall-off in the 25 day (56.6%) and subsequent 42 day (39.3%) results:

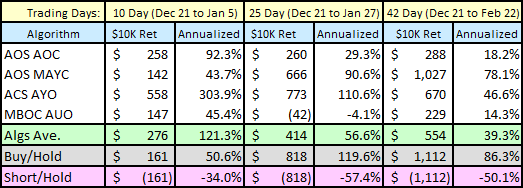
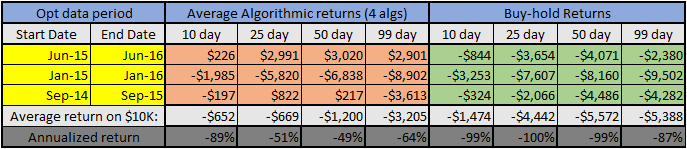
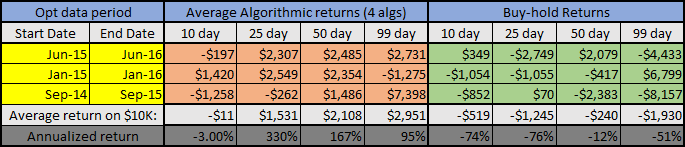
This study was done over a time period of unusual gains in the stock market and AMZN, the algorithms for 25 day and 42 day failed to keep up with buy/hold. But if you focus on that, you would be missing the most important point--that following the algorithms eliminates all the buy/sell/short/cover decision making.

The Strategies

The following sections were updated daily during the course of the live study, so that readers could follow along with the four algorithms as they progressed day to day. The last day published this way was day 20 which is shown below.


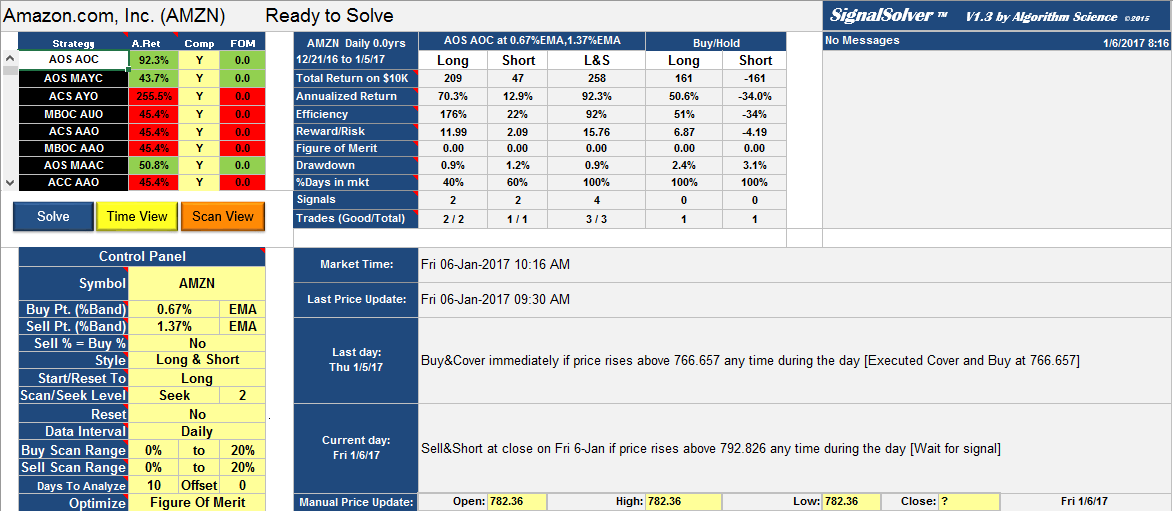
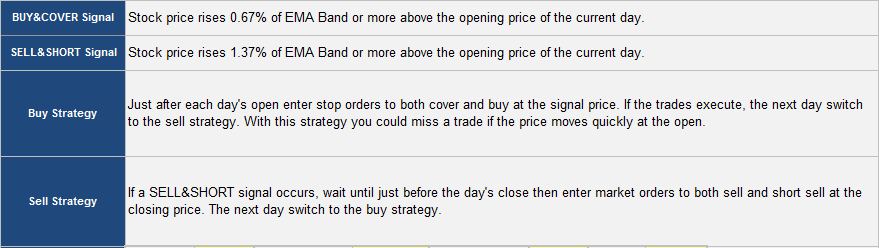
Strategy 1: AOS 0.67% EMA AOC 1.37% EMA--Day 20


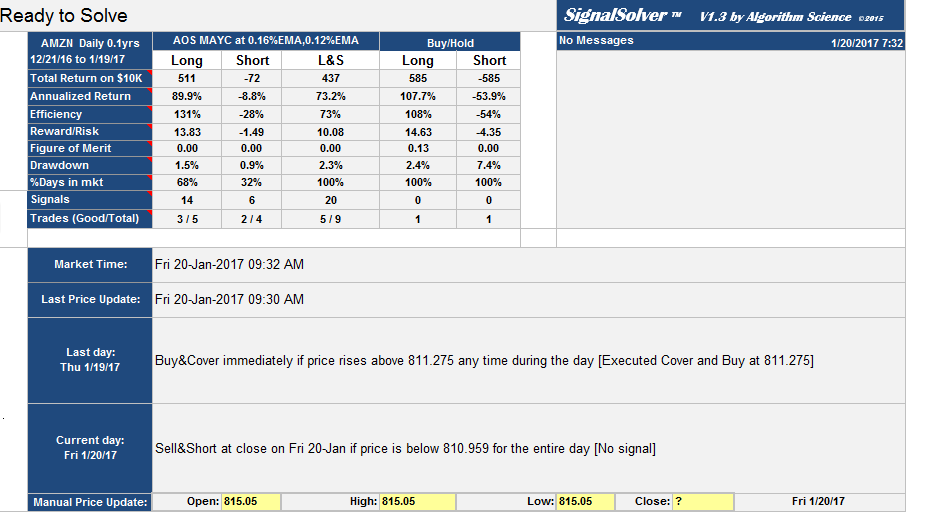
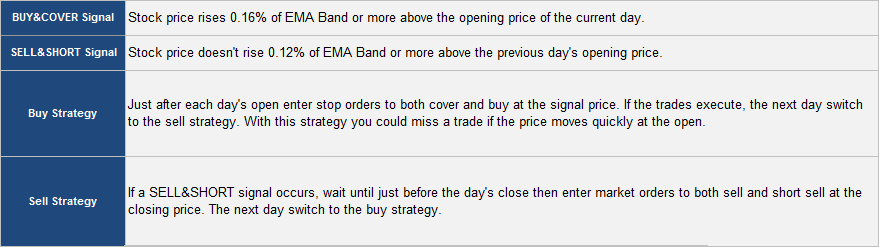
Strategy 2: AOS 0.16% EMA MAYC 0.12% EMA--Day 20


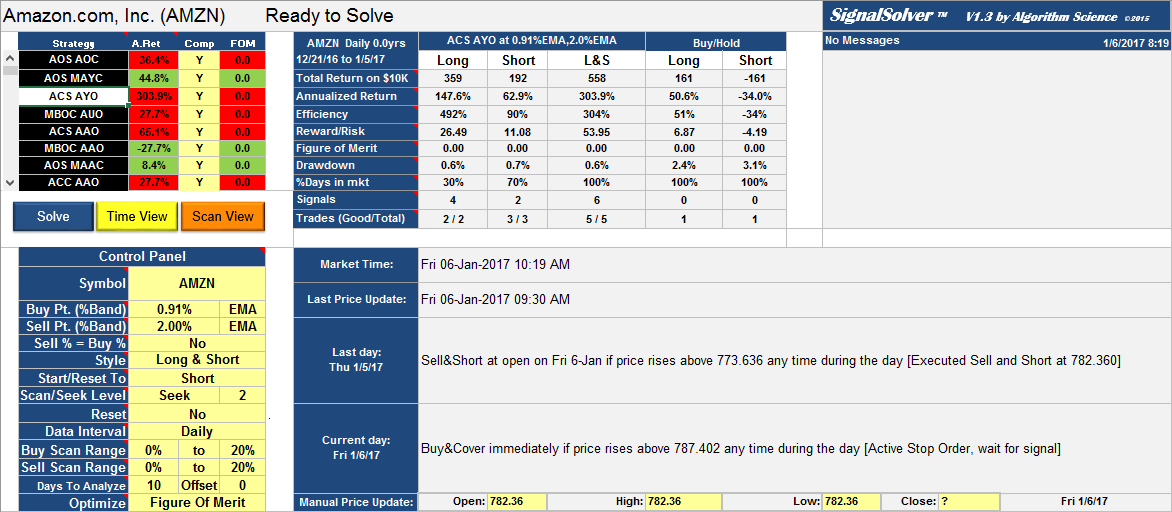
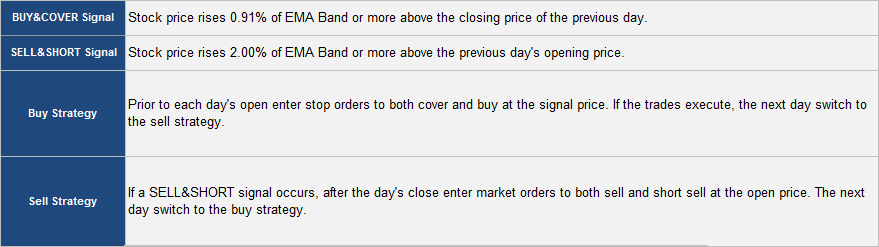
Strategy 3: ACS 0.91% EMA AYO 2.0% EMA--Day 20


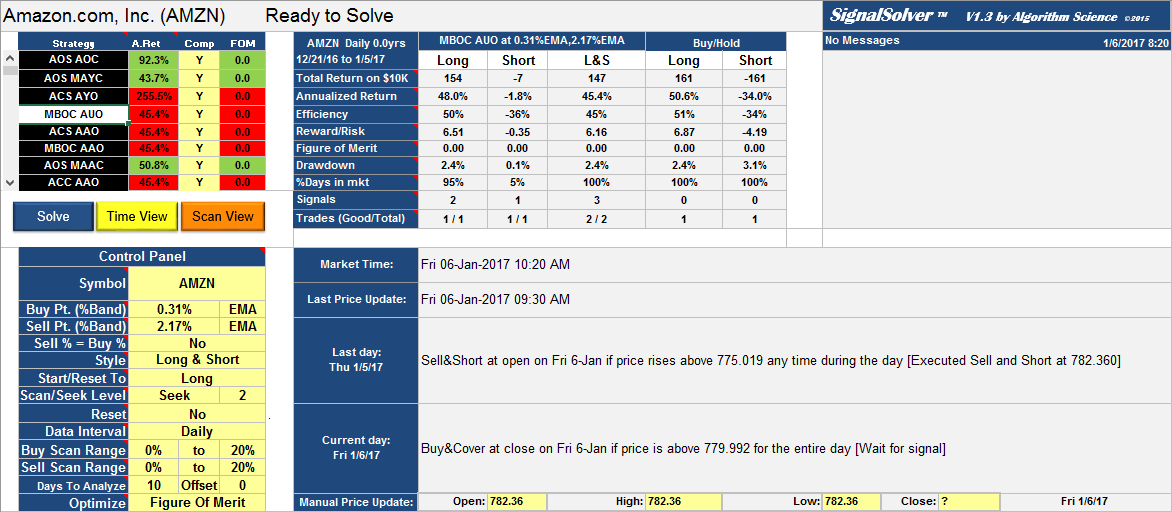
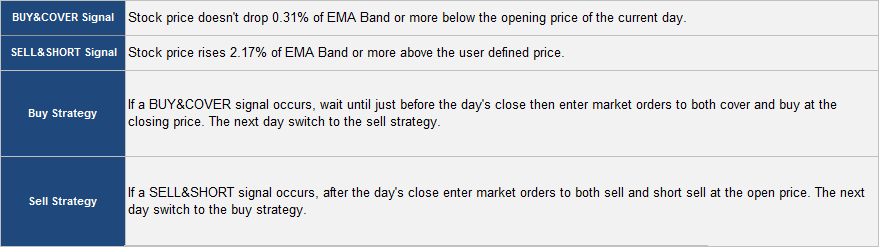
Strategy 4: MBOC 0.31% EMA AUO 2.17% EMA--Day 20


The Strategies

Strategy 1:

Strategy 2

Strategy 3:

Strategy 4:


AMZN Top 4 Algorithms: performance update at day 10 (Jan 5th 2017)

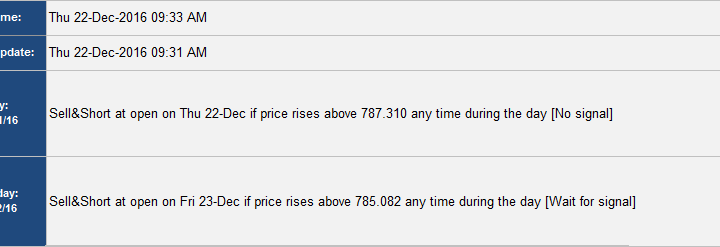
Happy new year. If you had been following along for the last 10 trading days you would have seen me publish a daily description of each the trade before and after it was made, including the type of order to be placed and when, so there was no cheating--this was a live, real-time test.

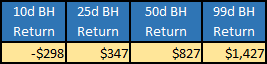
At trading day 10 (yesterday Jan 5th 2017) I am pleased to report that all 4 algorithms are showing a profit: For $10K invested in each, alg 1 profit was $258, alg 2 $142, alg 3 $558, alg 4 $147. This includes all trading costs ($7 per trade) and was for Long and Short sides combined (see L&S columns below). Just the long side did almost as well (Long column below). Of 15 total trades, 13 were profitable. Average profit was $276 or around 95% annualized return. For the same period, buy-hold return was $161 or 50.6% annualized.

The point to note here is that the combined algorithms showed a profit. Not only that, they did a much better job of exploiting the price movements than either buy-hold or short-hold. The SignalSolver algorithms make buy-sell decisions based purely on numerical analysis of  past price movements. As a technical analysis methodology I must say it did a good job in this case.

I will continue to give daily trade instructions just after each NYSE open. I will report performance out again on day 25, the end of the test period, although I expect it to decline as the algorithms age. After that we need to re-optimize to new algorithms as I expect performance of these 4 to fall off.


AAPL $31,000,000 trading strategy, equity curve

AAPL $31,000,000 Algorithm

This AAPL trading strategy would have given a return of $31,712,009 for every dollar invested in December 1980. That's 123,000 times better than buy-hold, with nearly four times the annualized return (61.4% vs 16.7% for buy-hold) and roughly half the drawdown which  amounts to over six times better reward/risk than buy-hold.

AAPL $31,000,000 trading strategy: Table of results

AAPL $31,000,000 trading strategy: Table of results

This is a variation of the MASC BAO algorithm which I have published before,  except this time the buy point is related to a Bollinger Band instead of just the sell price. I found it using SignalSolver.

Here is the strategy:

Description of the AAPL $31,000,000 trading strategy

Description of the AAPL $31,000,000 trading strategy


In this case the Bollinger band is the 7 period StdDev of median prices (monthly (H+L)/2), and the band is built around the last sell price, not the usual method of building it around a moving average. A little unconventional but it worked wonderfully. Algorithms with buy signals based on sell price often get stuck, but this one didn't. Sell signals were based on a raw Percentage Band built around the monthly median (H+L)/2 prices, just like the original version of this.

Here is the equity curve:

AAPL $31,000,000 trading strategy, equity curve

We are looking at quite a bit of reinforcement on buy signals, but sell signals tend to come in ones or twos. There are some dual signal months but not too many. Dual signals will trigger a trade for this algorithm.

Moving onto the scans, you can see that there is a single area of profitability:

Annualized return vs. buy and sell point for the AAPL $31,000,000 trading strategy

Getting the buy or especially the sell point wrong would have led to a complete loss, as this algorithm was run Long and Short (you were either long or short at all times). Here's the entire parameter surface, for completeness:

AAPL $31,000,000 trading strategy, parameter surface

A bit of a steep sided mesa, but a reasonably large plateau.

Since I found it in June, the algorithm has added about 3%, but it hasn't traded and is still long.

Here are the trades: AAPL.M4 List of trades


AAPL MASC BAO Update Aug 4th 2017

The algorithm has added around 40% since publication in Dec 2016, return on $10K would now be $432,155,847,777 . There have been no signals or trades and the position remains long.

AAPL Monthly Trading Algorithm MASC BAO $432,155,847,777 return for $10K initial investment, update 8/4/2017

AAPL Monthly Trading Algorithm MASC BAO $432,155,847,777 return for $10K initial investment, update 8/4/2017


Multi-algorithm test results for NUGT (4 algorithms)

Multi-algorithm study results for NUGT DUST and X

In the interests of scientific method, I'd like to continue the multi-algorithm study by discussing the worst results, those for X (United States Steel Corp. ), NUGT(Direxion Daily Gold Miners Bull 3X ETF) and DUST(Direxion Daily Gold Miners Bear 3X ETF). There was plenty of potential for disaster in these stocks, very large swings indeed. In fact, as you shall see, these often led to total loss of capital because the algorithms were run both Long and Short--if the stock price doubles and you are short, you are wiped out. All the results for the study can be found in the spreadsheets.

Multi-algorithm test results for X (United States Steel Corp.)

     Multi-algorithm test results for X (United States Steel Corp.)

Multi-algorithm test results for X (United States Steel Corp.)

While the September and Jan optimizations were almost all lossy, the Jun optimizations led to profits for the 50 and 99 day horizons, so overall, losses were fairly neutral. But the technique clearly failed to exploit the price movements of X. Look at the January buy-hold figures, there was plenty of room for profit on the long side, but harshly negative profits for the algorithms.  Similarly for Sept optimizations on the short side.

Multi-algorithm test results for NUGT

Multi-algorithm test results for NUGT (4 algorithms)

Multi-algorithm test results for NUGT (4 algorithms)

The January optimization results are the worst. 25 days into the test, 3 out of the 4 algorithms had gone belly up with a complete loss. Before the 99 days had elapsed, the fourth algorithm had also died off. Not that difficult to understand, though. For the Jan 15 to Jan 16 optimization period the stock price had dropped from $42 down to $3.50, consequently, all the algorithms had a strong short bias. Just at the start of the out-of-sample runs, the stock price started rising, from $3.50 up to $21 at the end of the 99 days. Oh well. On the positive side, most of these losses were offset by the June optimization results, so it  ends up being pretty flat returns overall, but sadly leaving these huge swings unexploited.

Multi-algorithm test results for DUST

Four algorithm result for DUST

Four algorithm result for DUST

While the June optimizations led to some decent exploits, the Jan results were again pitiful, stock price dropped from $1000 to $50, and the algorithms had a buy bias, so not a good result.


Multi-algorithm results for UWTI

Oil had a rocky year, lets look at how our multi-algorithm approach worked on an oil related stock, UWTI (VelocityShares 3x Long Crude Oil ETN). In this post, I'm just going to summarize the results:

Briefly, the method used is to run SignalSolver to find trading systems which worked for a 250 day period, then run these trading system against the data immediately following the 250 day period to see how they performed. This is known as out-of-sample testing as none of this following data is included in the optimizations.

The methodology is identical to my previous posts. If you need more details you can download the results spreadsheets, or download SignalSolver and run the optimizations yourself. I have omitted the result for the Return optimization on the PB band this time because I think we have established that the Figure of Merit optimizations usually work better. They do here.

The idea is behind multi-algorithms is that using a single algorithm is risky, but running multiple algorithms at once averages out your risk and leads to more consistent and more efficient (since you are sometimes out of the market) results. Here, we averaged over the top 4 algorithms for each period.

You can see that the multi-algorithmic approach gave very good results for the 25 day (5 weeks of trading) and 50 day runs. If you look at the buy-hold profile you can see that you would have had a rough time guessing long and short entry and exits to get the same results. Not saying it couldn't be done, but using the multi-algorithmic approach would have given nice returns for UWTI with absolutely zero guesswork. And its based on sound numerical analysis, not hunches and tweets. Is anybody listening? 🙂

Multi-algorithm analysis for FB (Facebook)

Today, I'll just throw out some more results from the multi-algorithmic testing I've been doing with SignalSolver. This time for Facebook (symbol FB). This is a stock which moved a lot in the time-frames used in the study. Could SignalSolver correctly predict and capitalize on these price movements? Let's see...

Optimizations for June 2015 through June 2016

As described in the methodology and the AMZN results, two optimizations were run on the June 2015 through June 2016 stock price data, one which rewarded raw returns using the Percentage Band, the other which rewarded more consistent returns and using the EMA band. First, lets look at Buy-hold performance for the subsequent periods:

Now lets see if the algorithms were able to exploit these price movements.

Results of the Return Optimization:

Now, the results for the Figure of Merit optimizations:

and the multi-algorithm averages:

One difference to note is that the return optimized algorithms were started out in a long state (because the End State vote indicated Long 7 to 1), whereas the FOM optimized algorithms were started out of the market because there was no good consensus. Accordingly, these returns would have been realized with lower capital.

Jan 2015 to Jan 2016 FOM Results

Here's the buy-hold results:

A pretty dramatic rise at the end of Jan 16. Luckily, all the algorithms were started long, so we got a piece of the action:

Averages:

Averaging more algorithms simultaneously gave better results, for the most part. In fact for the 25 and 50 day we actually beat Buy-hold for the higher averages.


FB Sept 2014 to Sept 2105 FOM Optimizations

Buy-hold:

Another impressive set of returns (if you had guessed long). How did the algorithms do?

Good 10 and 25 day results, but hanging on for 50 trading days would have knocked a big hole in your profits. But,  had you held on for 99 days you would have beaten buy-hold very nicely.

Multi-algorithm tests for AMZN

Today I will be looking at some very interesting results of multi-algorithm testing on the stock AMZN (Amazon). The idea here is to use SignalSolver to find multiple trading systems which performed well in the past, then run those systems simultaneously on out-of-sample forward data to see what would have happened had you followed them in real life. We do this for up to 8 algorithms, for three timeframes.

AMZN: June 2015 to June 2016 Return Optimizations

Firstly lets look at the results of looking for trading systems which were optimized for data in the 6/19/2015 to 6/15/2016 time-frame (250 trading days), chosen only because it was 100 trading days prior to the date I pulled the price data, and I was looking at the subsequent 99 day performance. Here's how buy-hold did in that time-frame:

Initially, I simply optimized for Return, that is I looked for trading systems which gave the best return over the entire June '15 to '16 time period, then looked at how each of them did in the subsequent 10, 25, 50 and 99 days. Here's that result:

The "250 day AR" is the annualized return of each trading algorithm found, without a time machine these returns are purely academic and are just used for ranking. The "End State" is shown because it indicates whether the algorithm was bullish or bearish on the stock on the last day of the optimization. In this case 7 of the 8 top algorithms were bullish (L) so for all the out-of-sample results, the start state was long (see the methodology posting for more information on this voting system).

These numbers are all over the place, so lets average them to see if we could have run multiple algorithms at a profit:

The leftmost four bars shows the result of running just the top algorithm (BMO BCO). Moving right, we add more and more algorithms into the mix, until at the rightmost bars we are looking at the results of running 8 trading algorithms simultaneously. So averaging worked to our advantage in this case.

AMZN Figure of Merit Optimization on June '15-'16 data

Optimizing the trading algorithms simply for returns can give you trading systems which don't do very well moving forward, we've seen that over and over in these pages. Often these trading systems exploit price changes in a small timeframe, and quickly go sour as time advances. Accordingly, I revamped the optimization to look for algorithms which gave more consistent returns over time (again, see the methodology here). Here's that result:

You'll notice its a completely different set of algorithms, with a much lower 250 day AR than the Return optimized set and much higher FOMs (Figures of Merit--the optimization parameters). Notice these algorithms are quite closely related to each other, more so than the Return optimized set. Accordingly, when you set about averaging this lot, here's what you get:

AMZN FOM Optimization for Jan '15 to Jan '16

Subsequent to the Jan '15 to Jan '16 timeframe, AMZN prices changed such that a $10K investment had this Profit/Loss profile:

Would SignalSolver be able to find the correct exploits? Here's the results of the FOM optimization:

All of these algorithms were bullish at the end of the optimization period, but most went short at the end of January '16 when AMZN prices dropped suddenly. Then they went long around 2/9/16 to capture the partial recovery. And the averaging result:

Ugly if you had run the just the top ranking algorithm, but good if you had averaged over 2 or more algorithms. Unusual for the algorithms to stay profitable for the 99 day, but here we see it. Overall a good result.

AMZN Sept '14 to Sept '15 FOM Optimization Results

Finally, lets wind the clock back another 100 trading days and take a look at the Sept '14 - Sept '15 result. Here is the buy-hold:

Here are the results:

Again, quite a different set of algorithms. Vote was bullish, so they were all long to start the out-of-sample period. Most of the algorithms got it right and stayed long. Curious that the best FOM algorithm got it wrong again. Here's the averaging results:

More on this later. Going for a bike ride in the desert now 🙂